
Annual Sales Figures
| Annual Sales Ranges | Number of Businesses |
|---|---|
| Uncoded records (Branches) | 1,949,168 |
| Under 500,000 | 13,575,772 |
| 500,000 – 999,999 | 782,921 |
| 1,000,000 – 2,499,999 | 543,359 |
| 2,500,000 – 4,999,999 | 221,782 |
| 5,000,000 – 9,999,999 | 144,157 |
| 10,000,000 – 99,999,999 | 175,443 |
| 100,000,000 – 499,999,999 | 23,486 |
| 500,000,000 – 999,999,999 | 4,025 |
| 1,000,000,000+ | 5,115 |
| Grand Total | 17,425,228 |
What are Annual Sales Figures?
Annual Sales Figures reflect the annual sales attributable to products and services sold by an organization annually. Sales Volume may be derived from sales, gross revenue, commissions, or billings.
The following report shows how many business locations have a Sales Volume that fits within each Sales Range. Branch locations report their figures at the Headquarters, so they will show as “Uncoded records” in this count.
Total Employee Figures
| Total Employee Ranges | Number of Businesses |
|---|---|
| Uncoded records | 1,844,647 |
| 1 – 4 employees | 12,133,264 |
| 5 – 9 employees | 1,918,540 |
| 10 – 19 employees | 802,758 |
| 20 – 49 employees | 407,492 |
| 50 – 99 employees | 151,461 |
| 100 – 249 employees | 89,662 |
| 250 – 499 employees | 33,587 |
| 500 – 999 employees | 19,393 |
| 1,000+ employees | 24,424 |
| Grand Total | 17,425,228 |
What are Total Employee Figures?
Total Employee Figures reflects the total number of people employed by all branches and subsidiaries of a business. This can include Part Time and Full Time workers, and remote workers.
The following report shows how many business locations have Total Employee figures that fit within each Employee range. We can also provide this type of report for Number of Employees Here (at just one location).
Quick Counts
Gain access to Businesses from all over the world. We can filter Companies by Geography, Industry, Size, and specialty segments like those listed below:
| Businesses Worldwide | 232,547,429 |
| US Business Entities | 17,550,448 |
| Single Location Businesses – US | 13,033,268 |
| Headquarter Locations – US | 447,419 |
| Branch Locations – US | 1,467,802 |
| Business with URLs | 7,149,405 |
| Opt-In Business Emails | 2,952,275 |
| Businesses with Active UCC Filing | 3,820,358 |
*Updated 2024-04-30
| Privately-Held Businesses | 14,296,068 |
| Publicly-Held Businesses | 367,319 |
| Woman-Owned Businesses | 925,662 |
| Minority-Owned Businesses | 250,068 |
| Veteran-Owned Businesses | 82,125 |
| Small Businesses | 12,012,428 |
| Home-Based Businesses | 3,149,986 |
| Independent Franchisees | 548,327 |
Market Analysis Profiles – Download Now!
Click to download an Excel document that shows the Number of US Businesses broken out by NAICS Industry and Company Size.
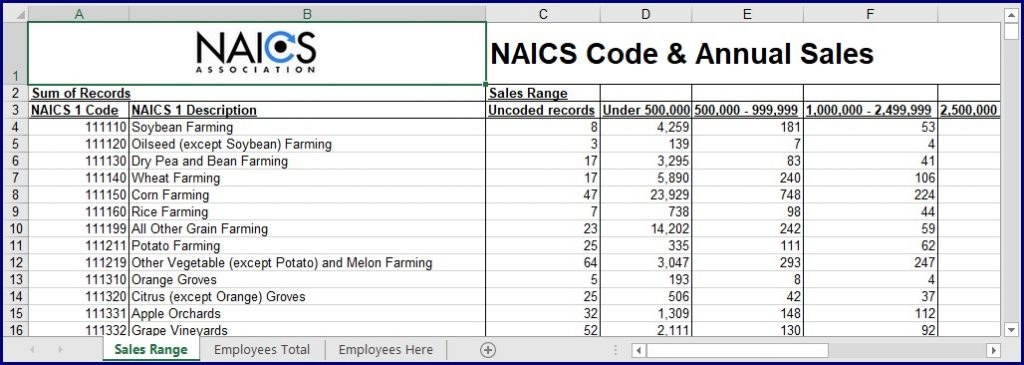
Each Worksheet contains all 1,040 NAICS Codes profiled by Size Ranges.
Utilize Market Intelligence
Create a Targeted Business Marketing List

Utilizing the most comprehensive, updated information available, we can provide NAICS and SIC lists to meet just about any need. With complete profiles on over 19 million US companies and 80 million businesses worldwide, we can create comprehensive and current targeted business lists for your sales and marketing initiatives.
US Company Lookup Tool
Identify Key Firmographic Details on Over 19 Million U.S. Companies.
Search Businesses by Company Name and Postal Code, Company Name and Address, and Phone Number.
Clone Your Best Customers – Target Market to Look-Alike Prospects

Duplicate your success with a look-alike prospect list of your current best customers.
Speak With One of Our Data Experts
973-625-5626
Download the Whitepaper
Additional Market Research Resources
Market Research Tools & Resources
A Guide to the 10 Best Free Online Market Research Tools: Get a Full Picture of Your Business Data and Market Segments.
Whitepaper Downloads
Downloads: How to Use NAICS & SIC Codes for Marketing & Cloning Your Best Customers for B2B Marketing Success
Business Data Blog
Valuable Content for Business Owners, CEOs, Marketers, Salespeople and Market Researchers.